






























Motivation
Placeholder text
Known PET-degrading enzymes are few, and each one took years of bench work to find and characterise. Public sequence databases hold far more candidate enzymes than any lab could ever test, so the limiting step is choosing which ones to make.
We built a model to make that choice. Given a sequence that has never been expressed, it estimates how likely the enzyme is to break down plastic, so that wet lab effort goes to the candidates most likely to work.
What Our Model Does
Placeholder text
Our model ranks candidate enzymes by predicted plastic-degrading activity. That ranking decided which sequences wet lab ordered and tested, and the assay results feed back in as new training data.
It is built from four components, each described in its own section below:
- Dataset Generation builds the corpus of candidate sequences the model ranks.
- Sequence Annotation describes each sequence with the features the model can learn from.
- Activity Data Extraction collects measured activity from the literature as training labels.
- Machine Learning learns from the labelled sequences and scores the rest of the corpus.
Placeholder figure
Pipeline overview: corpus, features and labels feeding the model, and the model's ranking feeding the wet lab library.
Dataset Generation
Placeholder text
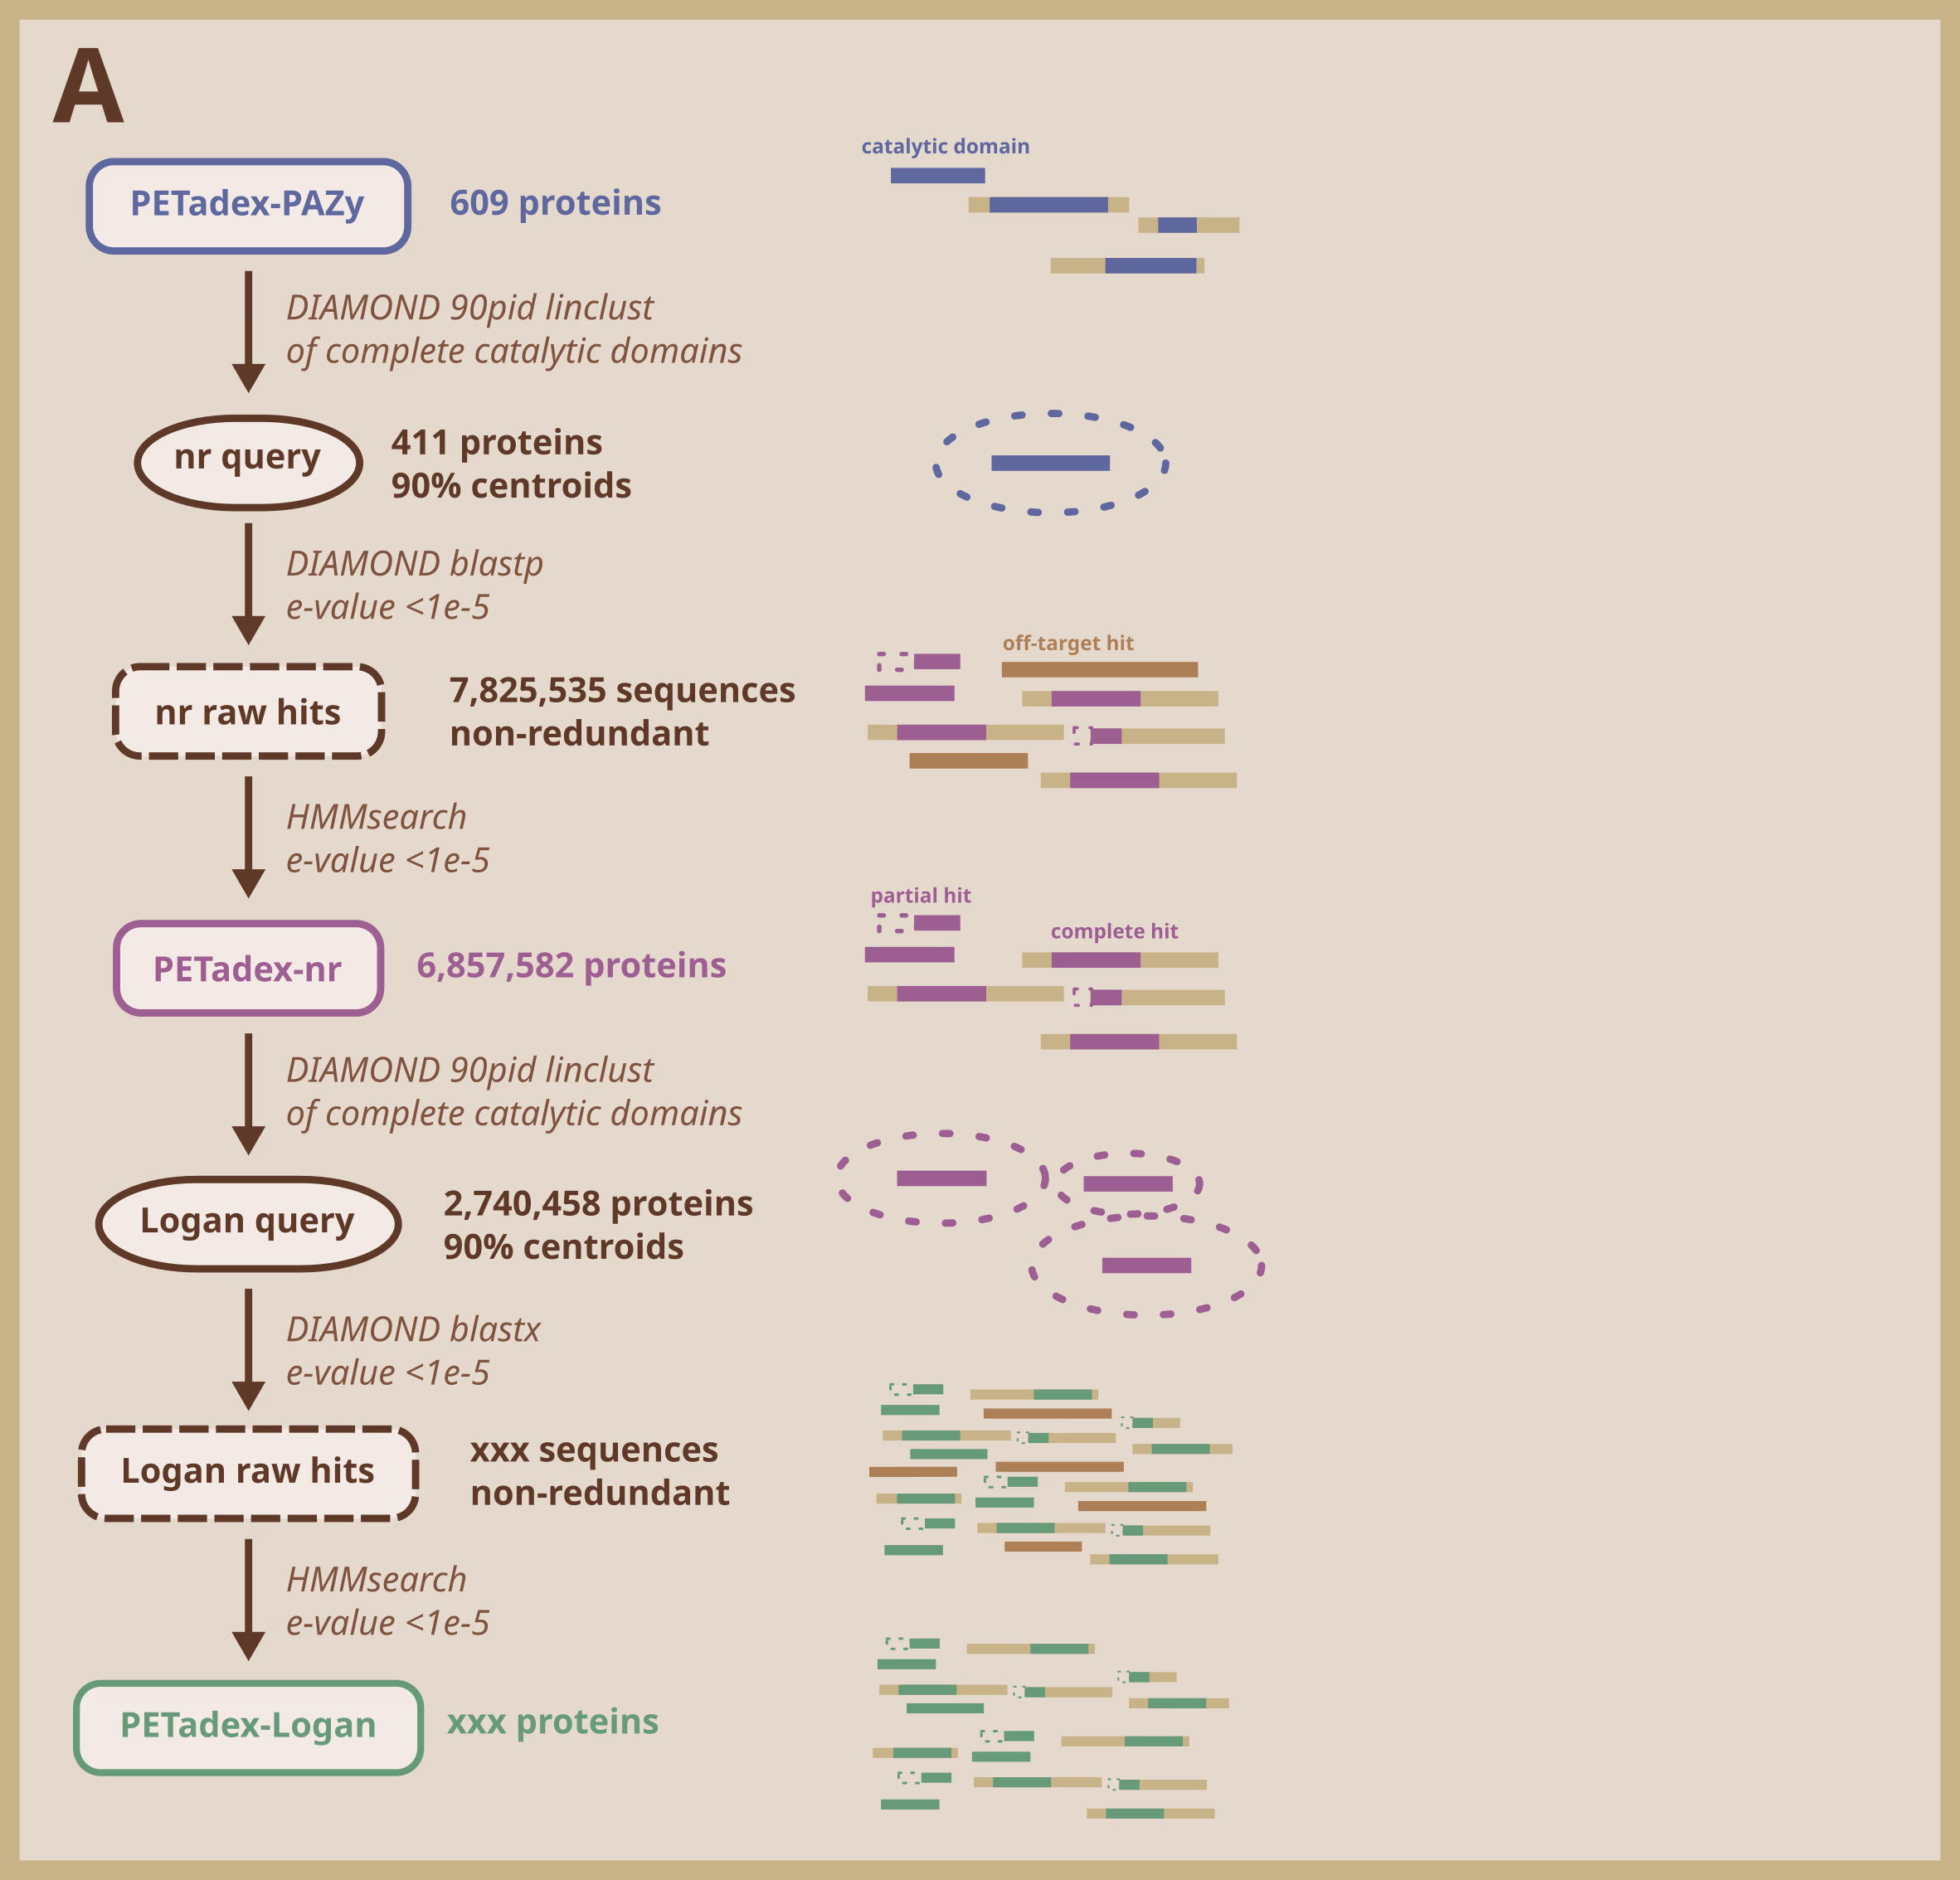
The corpus is the set of sequences the model scores. We start from the enzymes already reported to degrade plastic, curated and reconciled across the public reference databases, and group them into families by sequence similarity.
From each family we search outward, first into the NCBI protein database and then into assembled public sequencing data through Logan, using profile models that require the catalytic residues to be present. The sequences recovered are clustered at several identity thresholds so the corpus can be sampled without redundancy.
Plasticome Reference Curation
Owner: Dennis
Placeholder: PAZy pull, PlasticDB reconciliation, MD5 cascades, DOI backfill.
CATH Assignment
Owner: TBD
Placeholder: CATH fold assignment of the 609 reference proteins by Foldseek, Gene3D and Pfam; 606 of 609 annotated.
Component Assignment
Owner: Dennis
Placeholder: USEARCH all-pairs, ≥30% aaid, connected components, USEARCH/DIAMOND 2×2.
NCBI-nr Homology Expansion
Owner: Thomas
Placeholder: DIAMOND, 7.83M sequences at E ≤ 1e-5.
Seed MSAs and Catalytic HMMs
Owner: Thomas
Placeholder: 53 sub-component MSAs, residue-constrained iterative build.
Logan Query Extraction
Owner: Thomas
Placeholder: HMMs against Logan, the PETadex-Logan corpus.
Clustering and Corpus Structure
Owner: Dennis / Thomas
Placeholder: 30/60/90% centroids, cluster quantification, sample density.
Sequence Annotation
Placeholder text
Annotation supplies the features the model learns from. A raw sequence says little on its own, so we attach to each one what can be inferred about it: the environment its source sample came from, including growth temperature and pH; its domain architecture; its predicted three-dimensional structure; and where in the cell it is likely to be sent.
Each layer is computed across the corpus by its own pipeline, and coverage differs from layer to layer. We report that coverage here because a feature the model cannot see for most sequences cannot inform most predictions.
Biosample Metadata Annotations
Owner: Denis / Amar
Placeholder: temperature, pH, environment, organism, habitat, salinity.
Biosample Metadata Profiles
Owner: Dennis
Placeholder: 2.74M of 6.80M with real signal, stratified sampling.
Localization and Signal Peptides
SignalP 6.0 was run on all PETadex ORFs to identify the secreted enzymes within the database, which act as a more promising subset for degradation activity. Accounting for secreted enzymes also produces mature-protein sequences for more accurate downstream analysis. Bacterial enzymes primarily employ the Sec (Secretory) and Tat (Twin-Arginine Translocation) pathways, which export proteins before and after complete folding respectively. SignalP classifies conventional Sec signal peptides (SP), Sec-dependent lipoproteins (LIPO), twin-arginine Tat substrates (TAT), Tat-dependent lipoproteins (TATLIPO), and short type III pilin-like signals (PILIN). SignalP’s fast model in “Other” mode was used for throughput and preservation of all six signal peptide classifications. Benchmarking demonstrated that these parameters preserved sufficient accuracy in comparison to the slow model. It notably preserves accuracy in predicting the signal peptide cleavage site of eukaryotic sequences as well, despite not using the designated “Euk” mode.
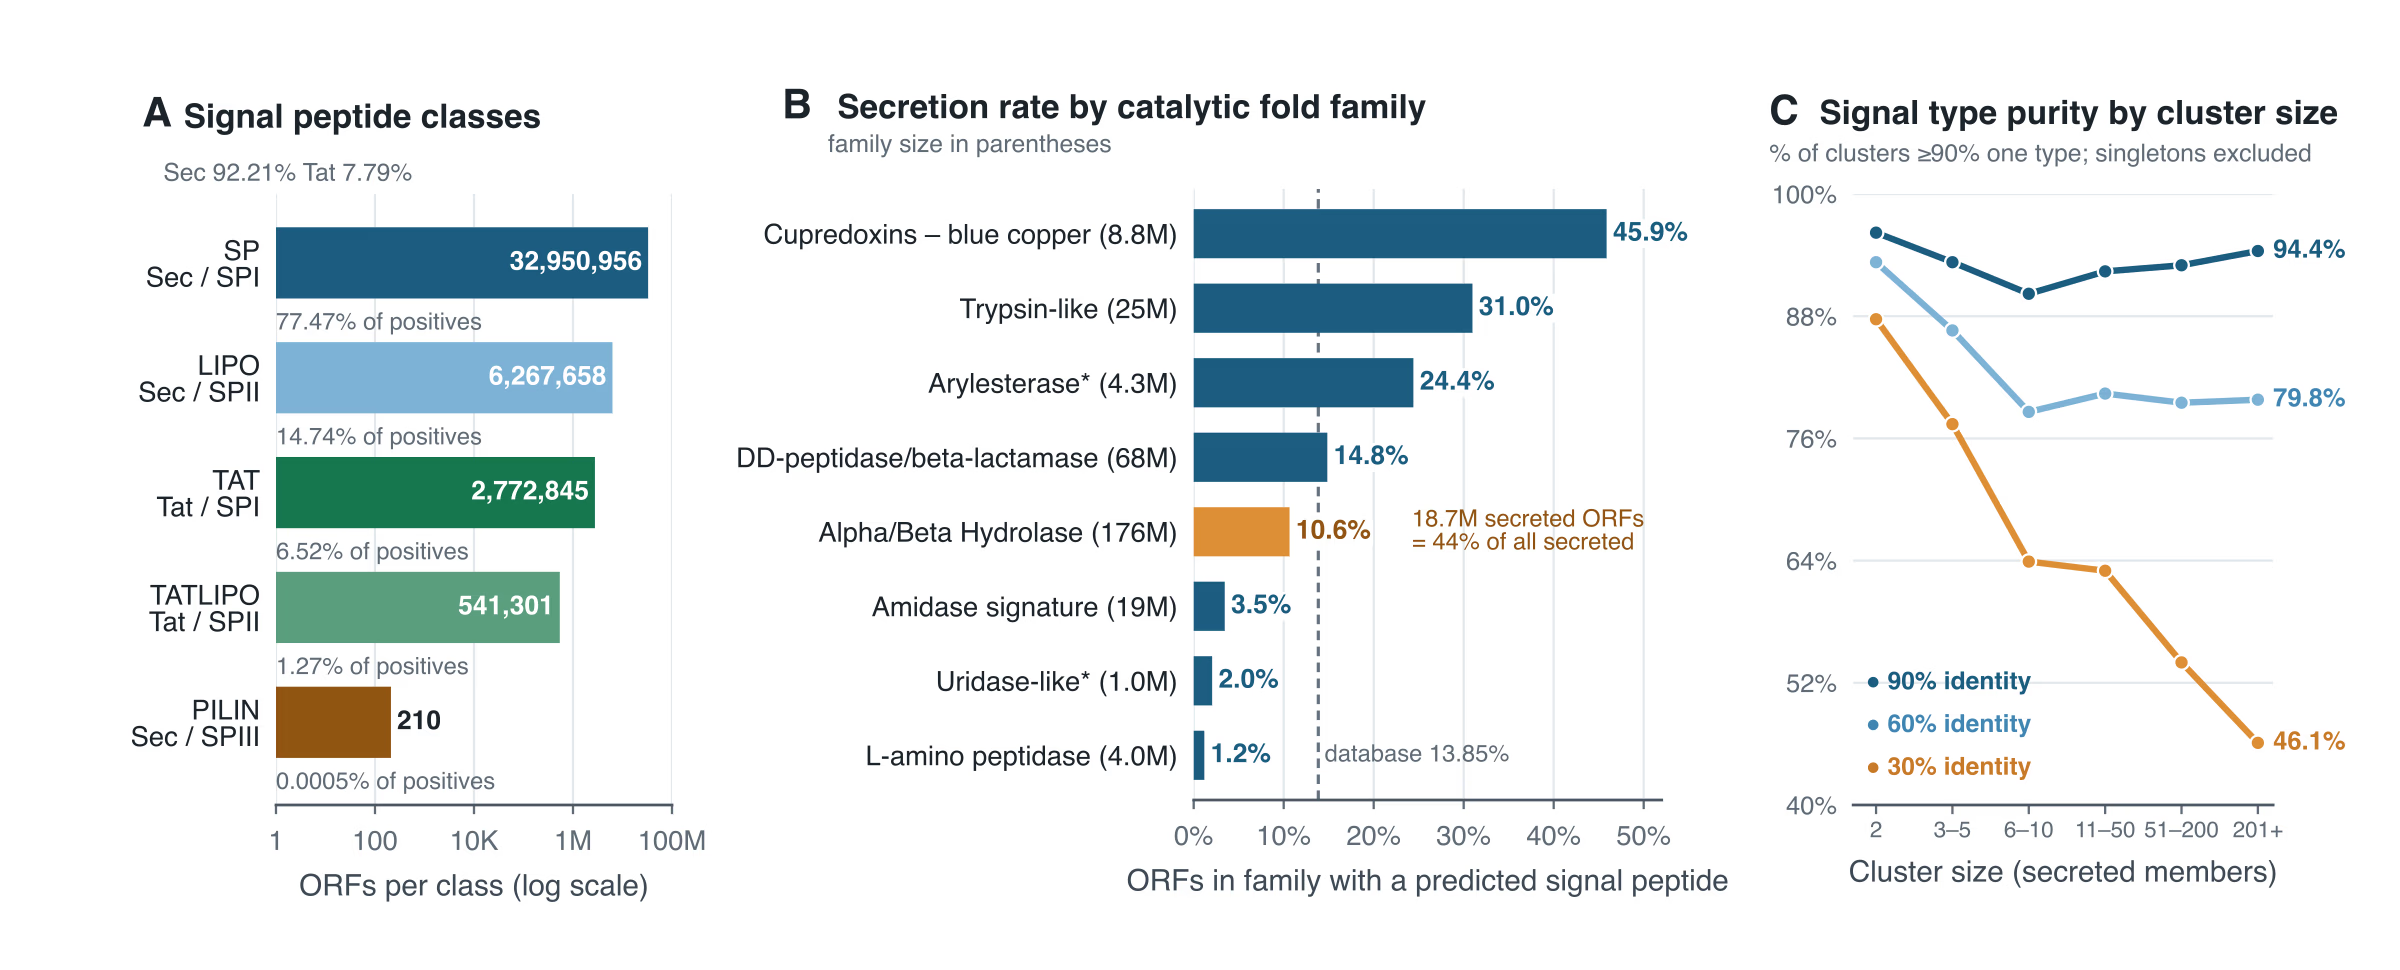
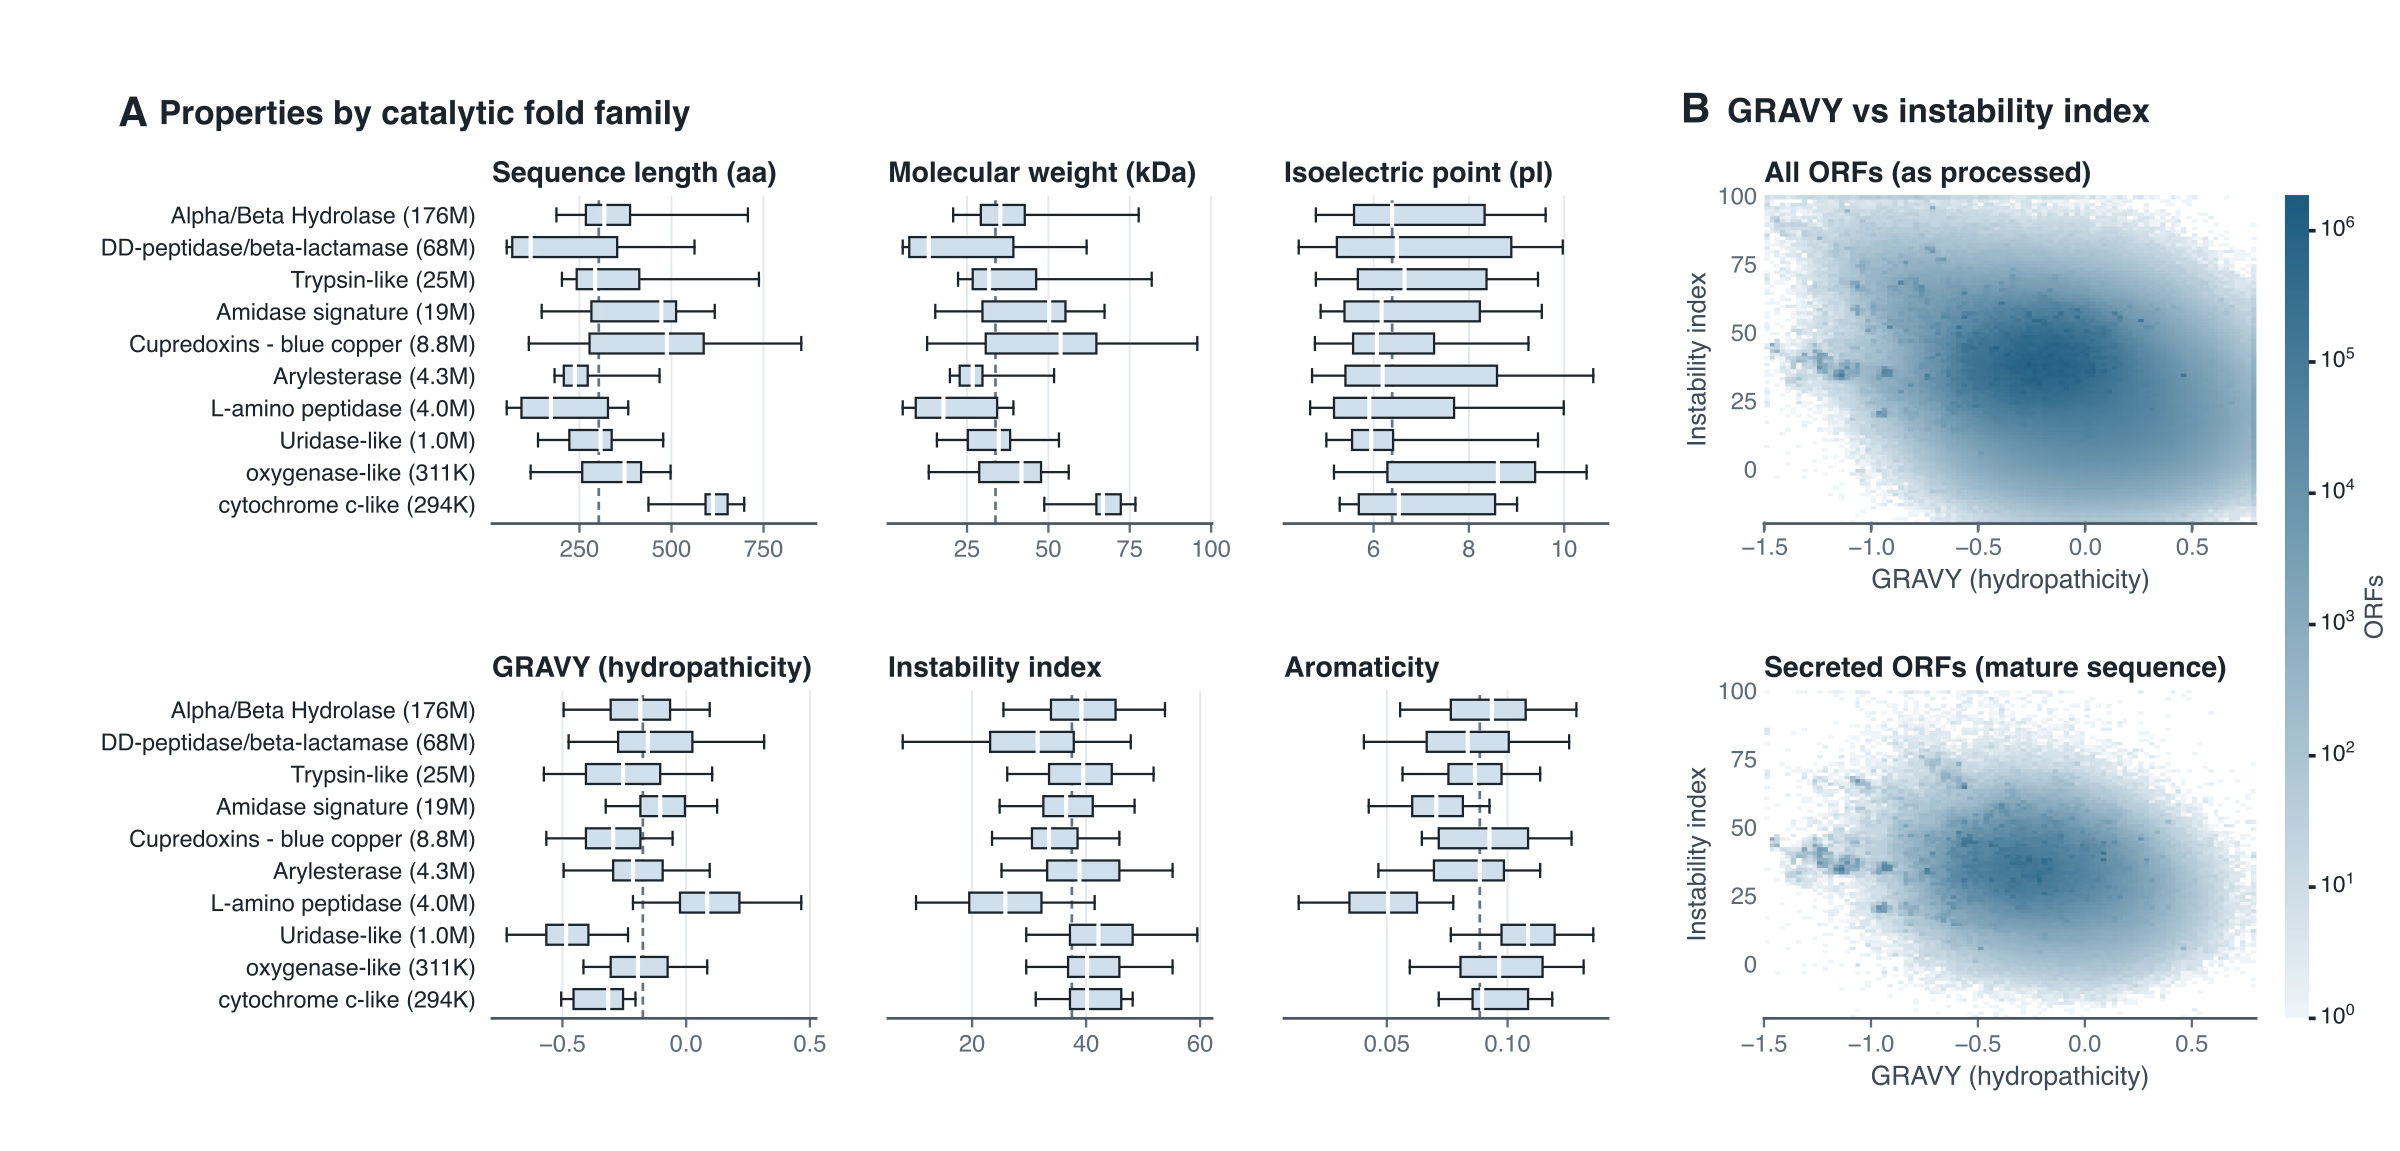
Overall, 13.85% of PETadex sequences were predicted to contain a signal peptide: 77.47% SP, 14.74% LIPO, 6.52% TAT, 1.27% TATLIPO, and 0.0005% PILIN, corresponding to 92.21% Sec and 7.79% Tat routing. Modal signal lengths were 28, 22, 52, 63, and 8 aa, respectively. Signal type was highly conserved at 90% identity, but became less homogeneous in large 30%-identity clusters, consistent with secretion strategy diverging across broader protein families. Secretion frequency also varied strongly by catalytic fold, from 45.9% in cupredoxins to 1.2% in L-amino peptidases. Alpha/Beta Hydrolases had a below-average secretion rate of 10.6%, but nevertheless contributed 44% of all predicted secreted ORFs.
Domain Annotation
Owner: Nino
Placeholder: InterProScan, Foldseek vs TED50, CATH assignment.
Novel Accessory Domains
Owner: Nino
Placeholder: TED reproduction across AFDB, nr, Logan corpora.
Predicted Structures
Owner: Alex
Placeholder: AFDB, ESMFold2, Narval ESM3 folding, confidence metrics.
Biochemical Properties and Ancestral Reconstruction
Six sequence-derived properties were calculated using Biopython Proparam for all PETadex ORFs: length, molecular weight, isoelectric point (pI), GRAVY hydrophobicity, instability index, and aromaticity. SignalP-positive ORFs were analyzed both before and after signal-peptide cleavage to represent both their precursor and mature forms. Median values were 308 aa, 34.2 kDa, pI 6.45, GRAVY −0.165, instability 37.5, and aromaticity 0.0885, with the overall GRAVY distribution characteristic of predominantly soluble rather than strongly hydrophobic proteins.
For secreted peptides, signal-peptide removal decreased GRAVY in 96.6% and pI in 86.6%, with strong GRAVY decrease for Sec-associated SP and LIPO classes and minimal decrease for Tat classes. Mature secreted proteins were also more hydrophilic than non-secreted proteins, and catalytic-family median GRAVY correlated strongly with secretion (Spearman ρ = −0.96). GRAVY showed the largest separation among catalytic families, spanning −0.485 to +0.085. L-amino peptidases were distinctive as the most hydrophobic, most stable, least aromatic, and least frequently secreted family (1.2%).
Placeholder demo
Sequence record card: one candidate enzyme with every annotation layer stacked.
Activity Data Extraction
Placeholder text
Labels tell the model which enzymes are known to work. Measured activity is scattered across the published literature in inconsistent formats, so we designed an extraction schema and a protocol for pulling it out of papers.
Human extractors worked through the papers in replicate without language-model assistance, and a language-model pipeline extracted the same fields independently. We measured how often the two agree, and that agreement is what tells us whether automated extraction can be trusted at a scale people cannot reach.
LLM Extraction Pipeline
To rapidly and accurately aggregate plastic-degrading enzyme data from academic literature, we developed an automated, high-precision extraction pipeline. Rather than relying solely on manual human curation (as is the case in other databases like PAZY) this pipeline leverages large language models (LLMs) to parse through 1000s of dense academic PDFs. The system is designed to find activity data on true plastic-degrading enzymes that were tested in primary papers ensuring the database is populated only with experimentally validated targets. This process involves a two-stage pipeline to extract relevant values, followed by numerous sanitation and verification steps to remove potential hallucinations and recover missing data.
Methods:
Articles were scraped using APIs and automated web-crawlers. An initial pool of plastic degrading papers were found using keyword searches and metadata accessions from PETadex sequences, then this pool was expanded by scraping papers cited by those papers, and papers that cited them. A combination of text extraction tools including Docling, Grobid and PyMuPDF were used to extract sectioned text from these pdfs, as well as convert figures into based encoded text. The relevancy of these papers were assessed using an LLM to remove papers with no activity data on plastic degrading enzymes. An extraction pipeline was built leveraging Claude Sonnet via AWS bedrock. The development of this pipeline came over several iterations of tests against synthetic controls and benchmarking experiments. Firstly synthetic controls were created using an LLM and human verifier to inject synthetic protein and assay data into 200 unique papers, these proteins included real plastic degrading enzymes with plausible activity data and decoy proteins that were not plastic degrading enzymes, then their capture and rejection rates were tested along the pipeline. Benchmarking experiments were run by comparing the outputs of Sonnet, Haiku, Opus and hybrid combinations (ie pass 1 using opus and pass 2 using sonnet) with each other to optimize the model used from those available. Finally results have been compared against human extracted data. Each of these testing steps were used to gauge the performance of the pipeline and improve on it for the next iteration.
Results:
The final extraction pipeline involved 8 LLM steps and 3 non-LLM steps costing around 33 cents/paper:
Pass 1: Sonnet 4.6 generates a dossier of all the plastic degrading enzymes in the paper and the experiments those enzymes participated with the corresponding substrates in using chronological thinking (followed steps while outputting “thinking”, ie: producing a full list of proteins, then eliminating the non-plastic ones, etc).
Pass 2: using the dossier from pass 1 Sonnet 4.6 extracts the relevant protein and activity data along with the exact verbatim evidence sentence the value was pulled from.
Verification step 1: Using regex to check if the verbatim evidence sentences truly originated from the papers or were hallucinated
Verification step 2: Using simple python, the enzyme-substrate combinations from the dossier in pass 1 is compared to the extracted list in pass 2, any new proteins are flagged for review (making it easier for later LLM steps will check) and any missing proteins are added in a notes section for LLM review
Verification step 3: A list of substrates is generated and compared against an exhaustive list of substrates to lightly flag any substrates not found in the list (making it easier for later LLM steps will check)
Verification step 4: Sonnet 4.6 is given a list of the proteins extracted and their substrates and checks to see if they are actually tested on plastic substrates. Removes any proteins that aren’t with associated protein data.
Rescue step 4.1: Sonnet 4.6 checks if any proteins that are tested against plastic/rubber substrates, are not mentioned in the list, adds them if they are
Verification step 5: Sonnet 4.6 is given the extracted values, the variable type (temp, ph, etc) and their associated evidence sentences to check if the values are correct and originate from the evidence sentence, the LLM will replace any incorrect values with either the correct value (if present in the evidence sentence) or “Not_Found”
Rescue step 5.1: Sonnet 4.6 is given the full papers and the extracted values that have “Not_Found” in the list, and looks for their actual values and an accompanying evidence sentence, verification step 4 is rerun on these sentences.
Verification step 6: Sonnet 4.6 is given the full paper and groups of variables and proteins that are associated with each other, then asked to ensure that each “relational pool” is correctly associated. Any values that aren’t are flagged.
Rescue step 6.1: Sonnet 4.6 takes the flagged values and associates them with the correct relational pool
When tested against synthetic controls the final version of the pipeline scored high:
100% decoy rejection rate (no false positives)
99.3% (152/153) Valid Spike-in Capture Rate (true positives)
100% (152/152) Relational linkage Assays and Proteins
98.8% (712/720) Assay Variable Extraction Rate
98.0% (196/200) Activity Metric Extraction Rate
When benchmarked against the other anthropic models Sonnet outperformed the other models with 95.0% Precision, 87.1% Recall, 90.9% F1 Score, 97.7% Global Metric Accuracy. Haiku: 90.1% Precision, 81.5% Recall, 85.6% F1 Score, 94.4% Global Metric Accuracy. Opus: 100.0% Precision, 9.1% Recall, 16.7% F1 Score, 98.1% Global Metric Accuracy (severely limited by under-extraction). And while the proteins extracted by the models varied, the proteins the models did agree on extracted the exact same data with minor formatting differences.
An initial run of this pipeline on ~4k papers yielded 27,244 experiments, 31,441 enzyme records (after merging 419 duplicates) and 61,771 measurement rows. PET and related compounds make up 32% of retained measurements and aliphatic polyesters (PCL, PLA, PHA, PBS) another 29%. Polyolefins are 7%, polyurethane 5% and polystyrene 4%. The most measured enzymes are Proteinase K, laccase, LCC-ICCG, PETase, IsPETase and HiC. About 19% of enzyme records are engineered mutants.
Schema Design and Extraction Protocol
In addition to an automated scraping pipeline, manual scraping was completed on a 60+ plastic degrading literature papers, entailing over 450 human hours. 20+ scrapers extracted data by filling out an interactive, standardized html schema as they read. This schema included the paper’s enzymes, variables, experiment setup, and every single activity point. The schema then formats their data into structured CSVs. The data acts as a ground truth to benchmark the capacity of LLMs in performing accurate data extraction from literature, as well as organizing data in a more readily filterable and interpretable form to support future endeavours for plastic researchers. Guiding Principles & Schema Logistics Standardization: The schema standardizes variables, plastic substrates, units, and additional specifications such as substrate pretreatment through predefined selections. An “Other” option preserves flexibility, while the remaining standardization improves data consistency, quantification, and transferability to LLM guidelines.
Structure & Traceability: When using the schema, scrapers begin by filling out a paper’s basic information and summary. They then navigate to an enzyme section for inputting entries of all plastic degrading enzymes tested within the paper, defining an Enzyme ID (name used within the paper) and its sequence. They are then able to add Experiments within a paper, defined as containing a single dependent plastic degradation activity metric and one or more independent variables. A unique Experiment ID is autogenerated for each. Finally, scrapers fill in a data table for each Experiment containing all the recorded degradation activity measured by the experiment alongside its associated independent variable values and Enzyme ID. The tree-like organization of the schema allows for intuitive decomposition of the paper into its critical data insights, and ensures that each datapoint can be traced via the IDs to their origin in case of future backsourcing.
Guardrailing: Systematic checks detect issues such as invalid enzyme sequences, incomplete rows, and missing required information, while dropdowns constrain entries to valid options. Widgets and pop-ups guide scrapers between sections, reducing common entry errors and simplifying the scraping workflow.
Results Current trends and results within the data are shown.
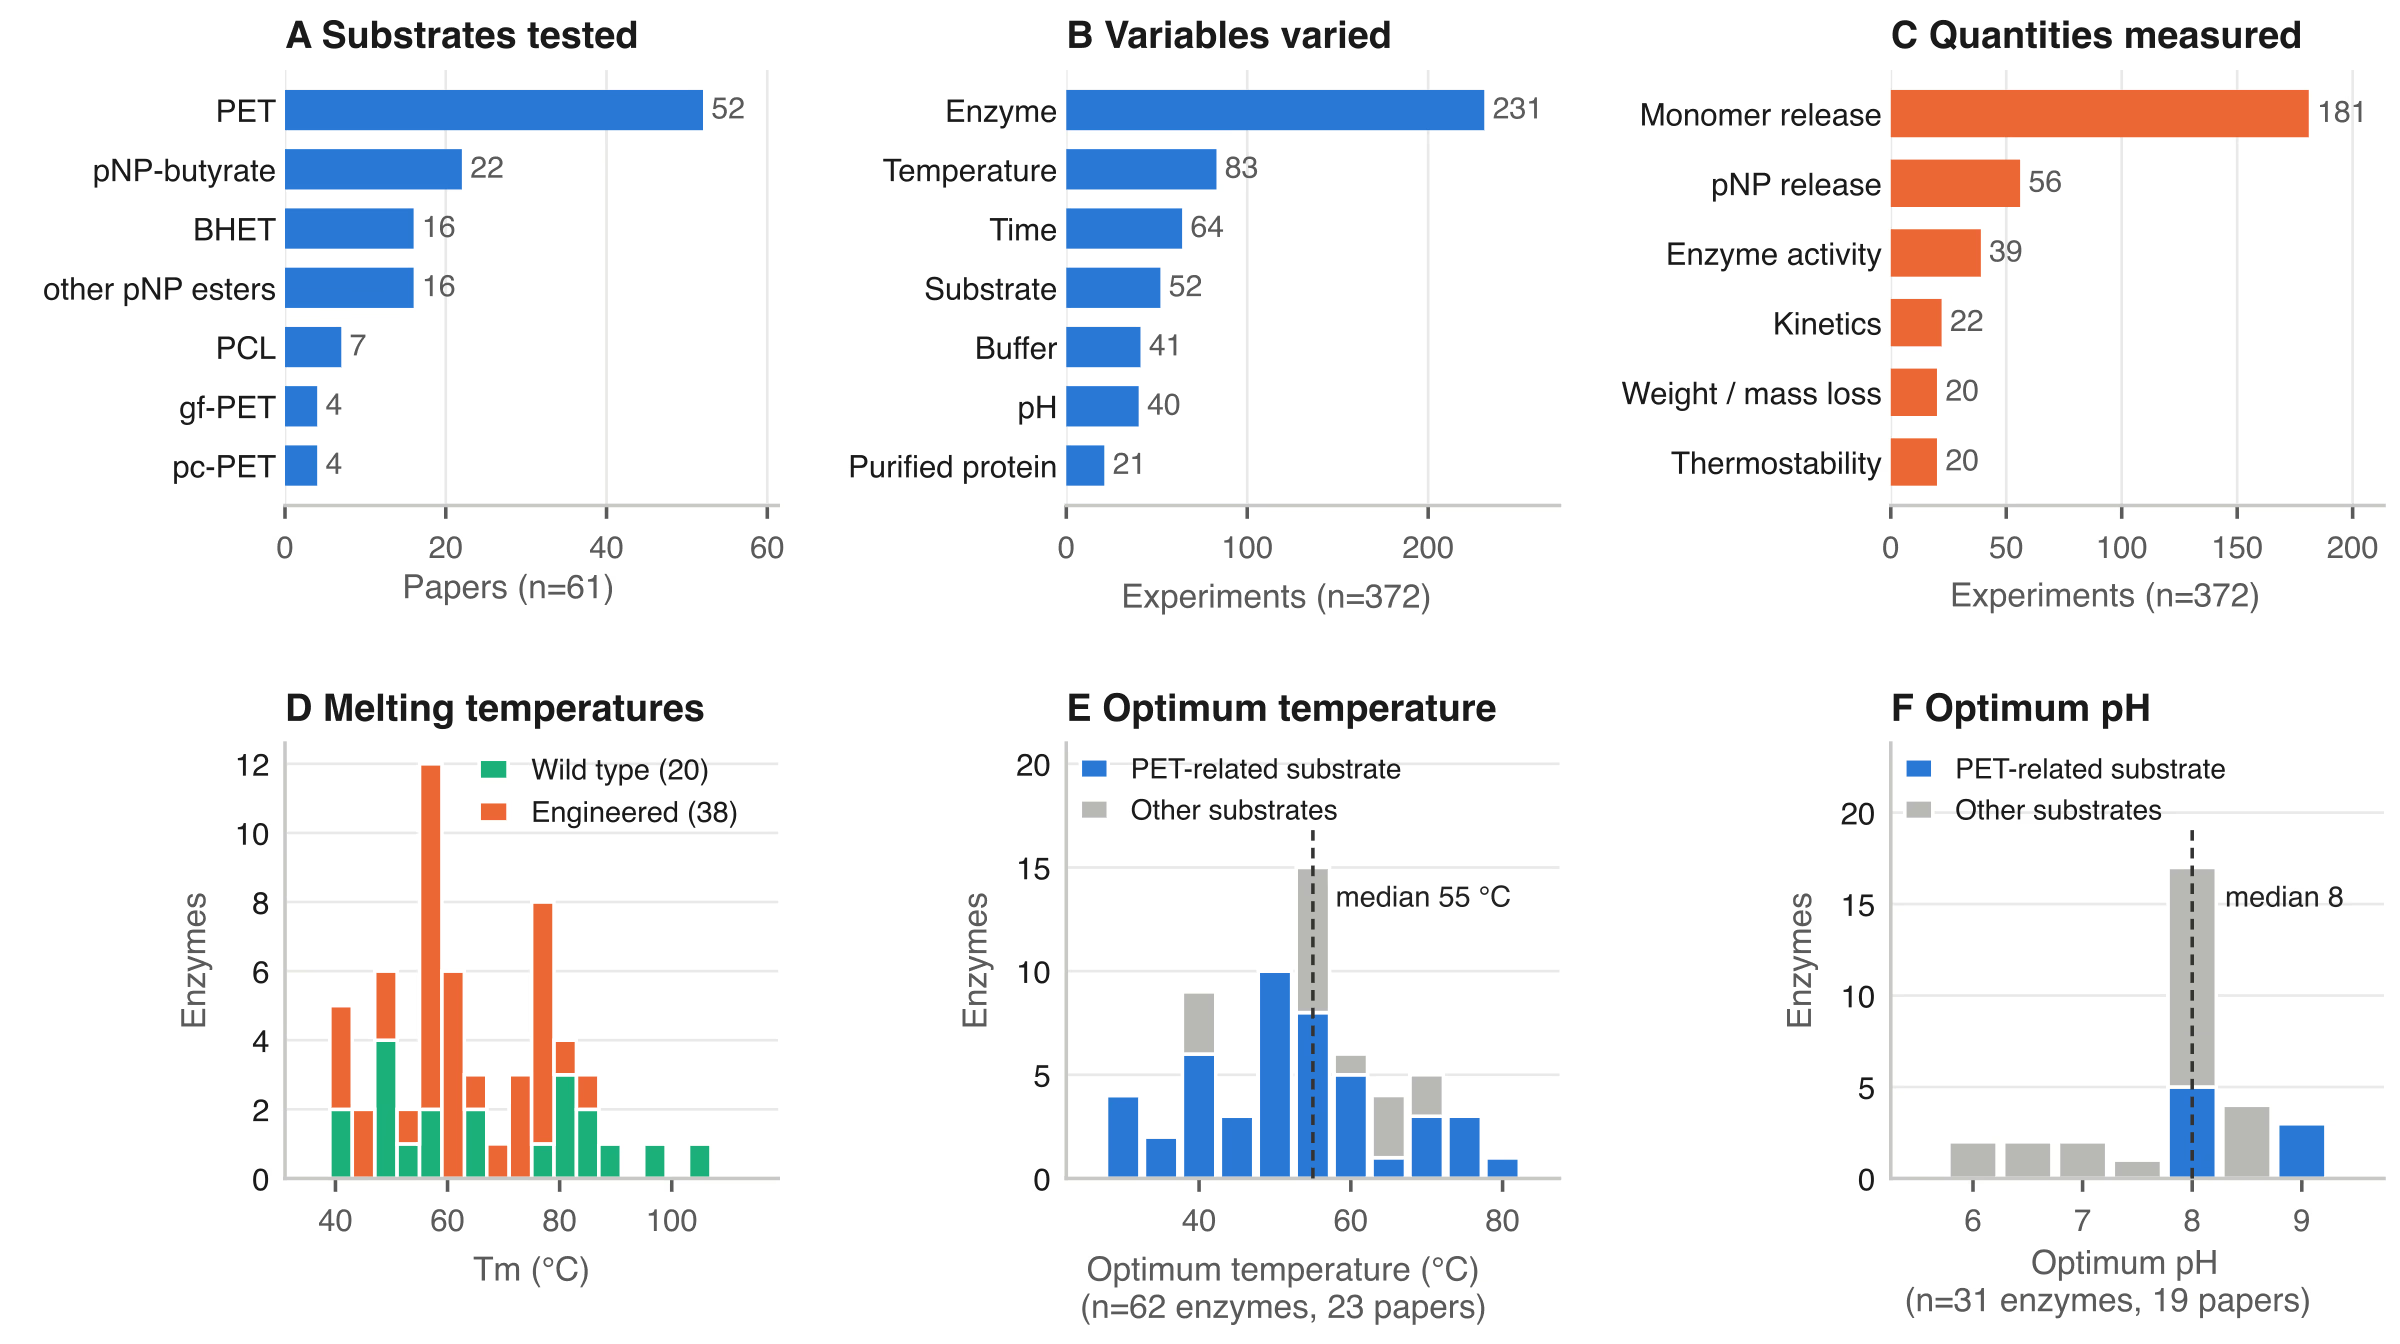
Most papers have also been independently extracted by two or more scrapers, and ongoing manual reconciliation efforts are being made to reconcile inconsistencies between scrapers to increase the confidence and quality of the data.
Human vs LLM Agreement
Finally when checking 26 LLM extracted papers against 26 double-human verified papers large discrepancies remain both between the LLM-Human comparisons and Human-Human comparisons. The LLM found 70% of enzymes either human listed (a second human finds 83%) and 90% of those both humans agreed on. Only 7 of 180 LLM enzyme names had no human match, and those were naming variants or whole-cell entries. When the enzyme and value match, the LLM's pH agrees 80% of the time (a second human: 91%) and buffer 75% (84%). The errors are usually a condition borrowed from another assay in the same paper, like pH 7 versus 8 for IsPETase, or 37 versus 50 °C for Dkca1. Temperature (92%) and plasmid (95%) are good.
Kinetics Dataset
Owner: Dennis
Placeholder: 464 records, 20-polymer library.
Placeholder figure
Agreement between human and language-model extraction.
Machine Learning
Placeholder text
Before trusting any prediction, we tested whether the model's internal representation of a sequence carries information beyond which organism it came from. This section opens with those controls and what they showed.
The representation comes from a protein language model that we adapted to plastic-degrading enzyme families and then used to embed the corpus. An activity classifier trained on the labelled sequences sits on top of it. We compare the adapted model against its unadapted base, and test whether adding annotation features improves on sequence alone.
Embedding Controls
Using the ESMC-XXXM Protein Language Model (PLM), we generated embeddings for X 30%pid PETadex centroids. These X dimensional embeddings were then UMAPed to 2 dimensions using the umap-learn (https://umap-learn.readthedocs.io/en/latest/) Python library, resulting in Figure 1.
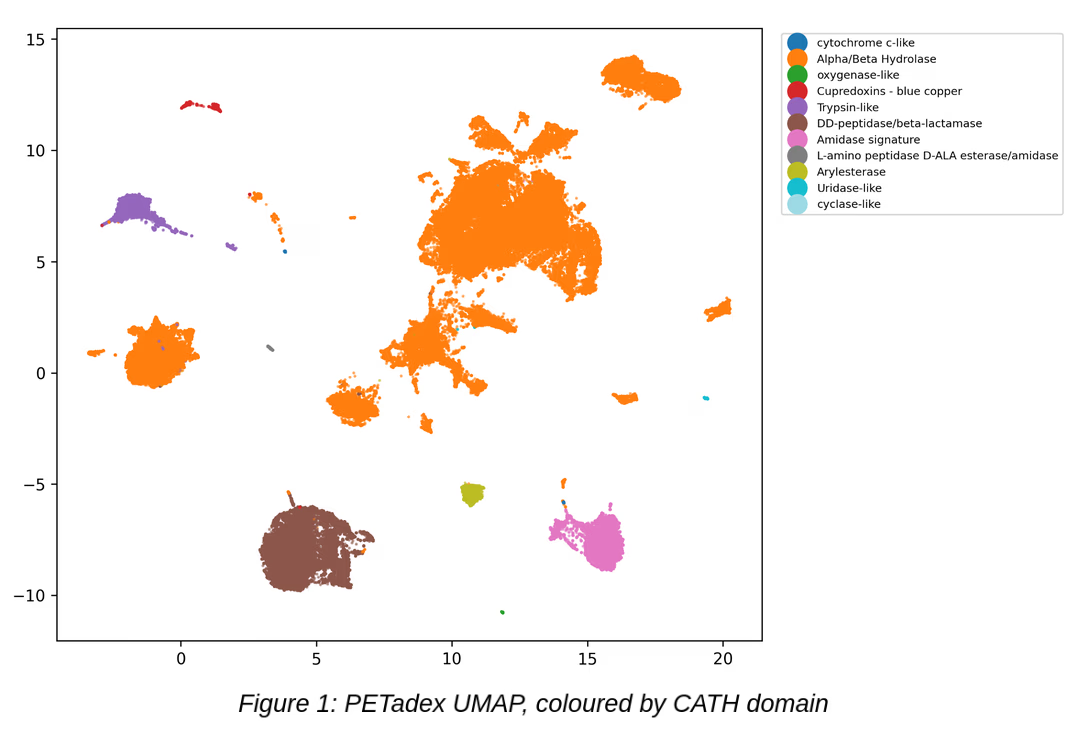
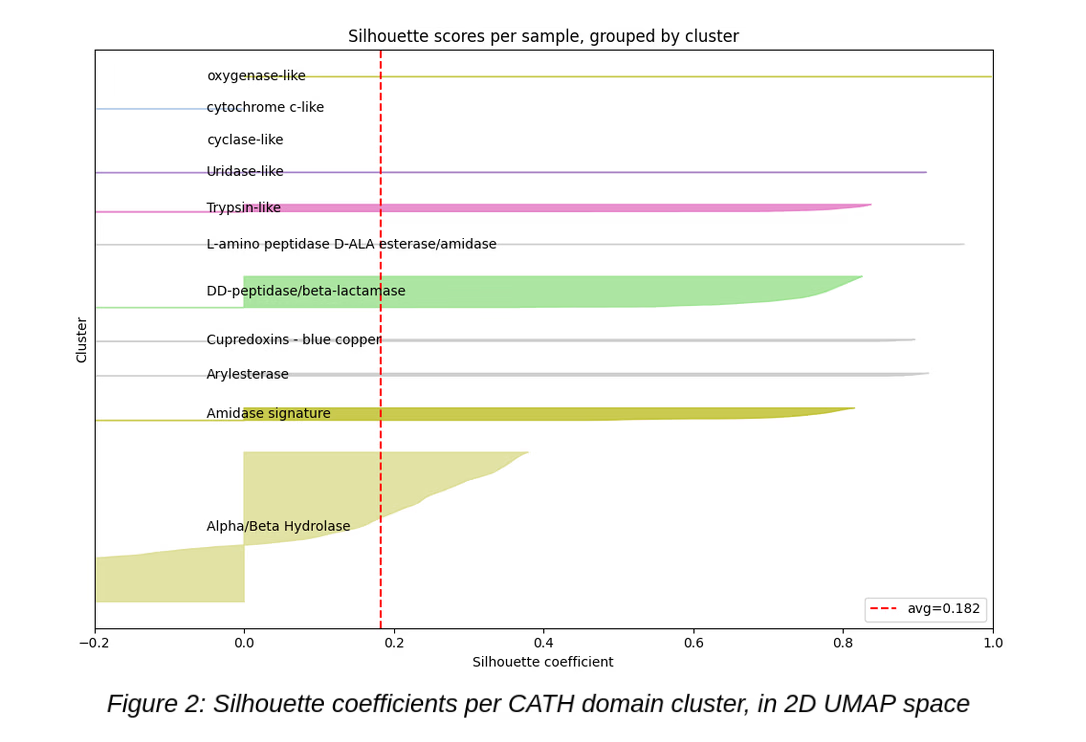
Noticing apparent clusters by CATH domains in the UMAP (See Figure 1), we ran further analysis to characterize these clusters, and investigate outliers. Silhouette scores found that most CATH domains were indeed highly clustered, minus Alpha/Beta Hydrolases, but since these make up ~⅔ of the PETadex, we would not expect them to be as tightly clustered. The distribution of silhouette scores per CATH domain is shown in Figure 2.
Notebook: https://github.com/petadex/igemtoronto/blob/main/notebooks/260324_issue51_clusterquantification.ipynb (issue #51)
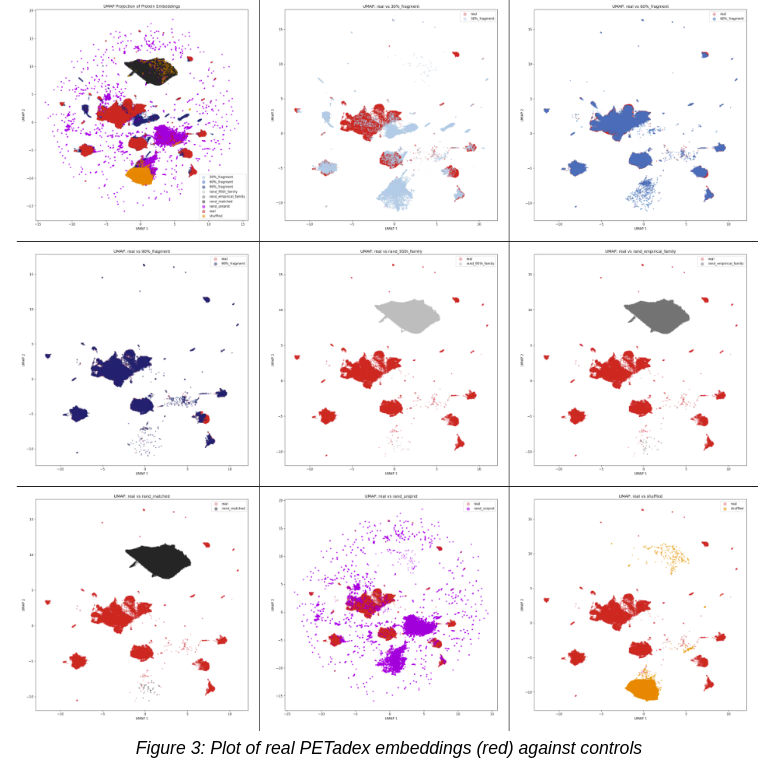
Finally, we ran controls on this UMAP to verify that this clustering does not appear by chance. Our objectives are the following: Generate negative controls (random and shuffled sequences) from the 64,730 family representatives, designed to disentangle amino-acid composition from sequence order. Generate positive / real-world controls (random UniProt proteins, real-sequence fragments) for comparison against the real centroids.
Controls are then embedded identically to the real proteins, and UMAPed alongside them, as seen in Figure 3. We found that the shuffled sequences and random/matched/empirical form their own "junkyard" regions, far away from PETadex sequences, Uniprot embeddings are scattered randomly, and fragments hug the real data closely. These results confirmed that the clustering seen in our Atlas reflected real signal and meaning in ESMC embeddings.
Domain Adapted ESM-LoRA
Owner: Purav
Placeholder: PlasticESM, ESMC-300M, 18.17M catalytic centroids.
Corpus-Scale Embedding
Owner: Dennis
Placeholder: ESM-2 across ~300M sequences, ESM-C per-residue.
Activity Prediction
Owner: Dennis / Purav
Placeholder: PETai classifier, feature-block ablation, parallel label definitions.
Placeholder figure
Model architecture.
Limitations
Placeholder text
This section states what the model has not been shown to do. It covers the annotation choices that remain provisional, the shortage of confirmed inactive enzymes among the training labels, and the fact that experimental validation so far comes from a single round of assays.
Reproducibility and reuse
Placeholder text
This section points to the released model and training set, the analysis notebooks that record each step, and the parts of the pipeline another team could reuse for a different enzyme family.